
Executive summary
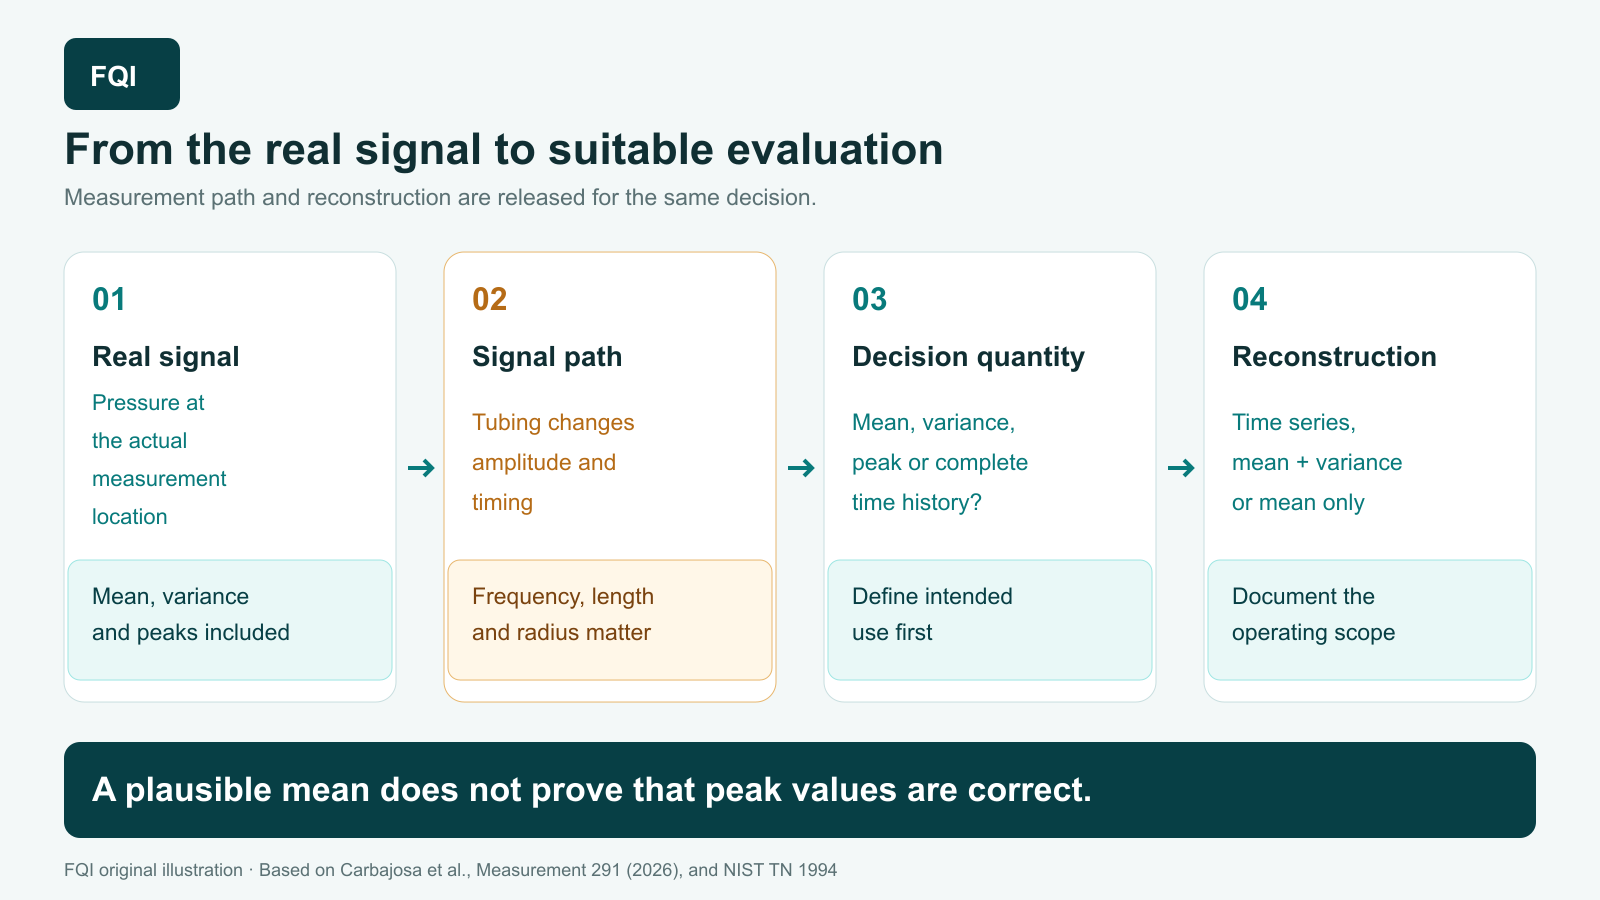
A sensor does not automatically report the quantity at the actual measurement point. In dynamic wind-tunnel pressure measurements, tubing changes the signal with frequency: amplitude and phase can shift even when the mean looks plausible. An open-access paper therefore defines three reconstruction tiers: the complete time series, mean plus variance, or mean only. The general FQI rule is that the released evaluation method must match the later quality decision.
FQI takeaway
- Treat the measurement path as part of the system: Tubing, geometry and frequency content can alter the recorded signal systematically.
- Align evaluation with intended use: A mean-value method is not automatically suitable for variance, peak loads or time histories.
- Release simplifications with a scope: At higher frequencies and with more complex tubing, simplified models can deviate materially.
The principle at a glance
The paper examines pressure measurements in which pneumatic tubes connect the measurement point to the pressure sensor. These tubes act as a dynamic transmission system. A transfer function describes how the path attenuates or amplifies individual frequencies and shifts them in time.
Terms explained
- Transfer function: A mathematical description of how a measurement path changes signal amplitude and phase with frequency.
- Phase: The timing shift of an oscillation relative to the original signal.
- Variance: A measure of how strongly values spread around their mean.
- MSA: Measurement System Analysis; a check that the complete measurement chain is suitable for the intended decision.
- NIST: The US National Institute of Standards and Technology.
- AI: Artificial intelligence; systems that derive patterns from data or automate tasks.
Deep dive
In wind-tunnel models, pressure sensors are often not located directly at the measurement point. Long, narrow tubes carry the pressure signal to the sensor. Rapid pressure changes may therefore be attenuated or amplified and shifted in phase. A static mean can still appear correct while variance, spectrum or peak values are already wrong.
The authors develop a simplified transfer function that avoids the mathematically more demanding Bessel functions in the established reference model. Their sensitivity analysis identifies disturbance frequency, tube length and tube radius as the dominant influences; temperature and pressure have weaker effects within the investigated ranges. The simplified formulation agrees closely with the reference at low frequencies. Deviations increase above approximately 100 hertz, especially when several tubes are connected.
The paper then defines three reconstruction tiers. The exact tier reconstructs the complete time series through frequency and inverse transformations. The theoretical tier calculates mean and variance without reconstructing the entire time series. The simplest tier uses mean values only. In the modelled cases, the exact and theoretical tiers agree closely for mean and variance. The mean-only tier may either overestimate or underestimate fluctuations depending on the spectrum and arrangement, so it is not reliably conservative.
This hierarchy transfers directly to quality management. Before evaluation, the required decision quantity must be defined: a stable mean, a variance measure, a peak or the time history. The team then checks whether the measurement path, sampling rate, transfer model and reconstruction tier can support it. A release for mean values must not silently expand to dynamic limits.
Technical Note 1994 from the US National Institute of Standards and Technology (NIST) provides an experimental reference. It shows that pneumatic tubing changes amplitude and phase and that numerically determined transfer functions can closely represent those effects under the tested conditions. The new paper uses that established model as a theoretical comparison, not as independent experimental validation of its own simplifications.
Limitations and risks
The new models were developed theoretically and tested against a reference model; their own controlled experimental validation is planned as future work. Assumptions include one-dimensional propagation, small disturbances and negligible internal volumes under defined conditions. Strongly nonlinear flow, other media, large cavities or higher frequencies may exceed the scope. Correct mathematical reconstruction also does not replace calibration, traceability or uncertainty evaluation for the rest of the measurement chain.
FQI conclusion
Measurement data are shaped by more than the sensor. The complete path from the real quantity to the stored number influences the result. The paper shows why a seemingly harmless simplification can work for means and still fail for variance or peaks. A defensible inspection plan therefore releases intended use, relevant frequencies, measurement path, reconstruction method and documented scope as one controlled package.
Sources & transparency
- Carbajosa et al.: A hierarchical methodology for transducer-to-real reconstruction in wind tunnel testing, Measurement, volume 291, article 123111, open access, DOI 10.1016/j.measurement.2026.123111.
- Kovarek et al.: Calibration of Dynamic Pressure in a Tubing System and Optimized Design of Tube Configuration, NIST Technical Note 1994, 2018.
Editorial note: The model tiers, influence factors and comparison results come from the sources. Applying them to MSA, released decision quantities and change control is FQI interpretation. This text was prepared with artificial intelligence (AI) support and remains a draft until explicit approval.