
Executive summary
AIAG and VDA published their first joint SPC manual on 1 July 2026. It harmonises previously differing approaches and terminology for machine performance, process performance, process capability, qualification, release and ongoing monitoring. Following the joint FMEA manual, SPC is now the second harmonised Core Tool. For FQI, the key message is not a new control chart but the explicit connection between FMEA, the Control Plan, MSA/VDA 5 and statistical process control as one continuous quality loop.
FQI takeaway
- SPC begins before the control chart: Risk analysis, characteristic selection, the measurement system and process release determine whether later signals can be interpreted meaningfully.
- Harmonisation needs a migration plan: Terminology, calculations, training, software and customer requirements must be aligned across sites and supply chains.
- Response is part of the method: A statistical signal creates value only when responsibilities, containment, cause analysis and effectiveness evidence are defined.
The principle at a glance
Source facts
According to the joint AIAG/VDA announcement, the manual creates a common basis for evaluating, monitoring and improving manufacturing processes across the global automotive supply chain. It supports machine-performance and process-capability studies, the qualification and release of production equipment and processes, and ongoing process monitoring. The publication explicitly links SPC with FMEA, the Control Plan and MSA/VDA 5.
FQI interpretation
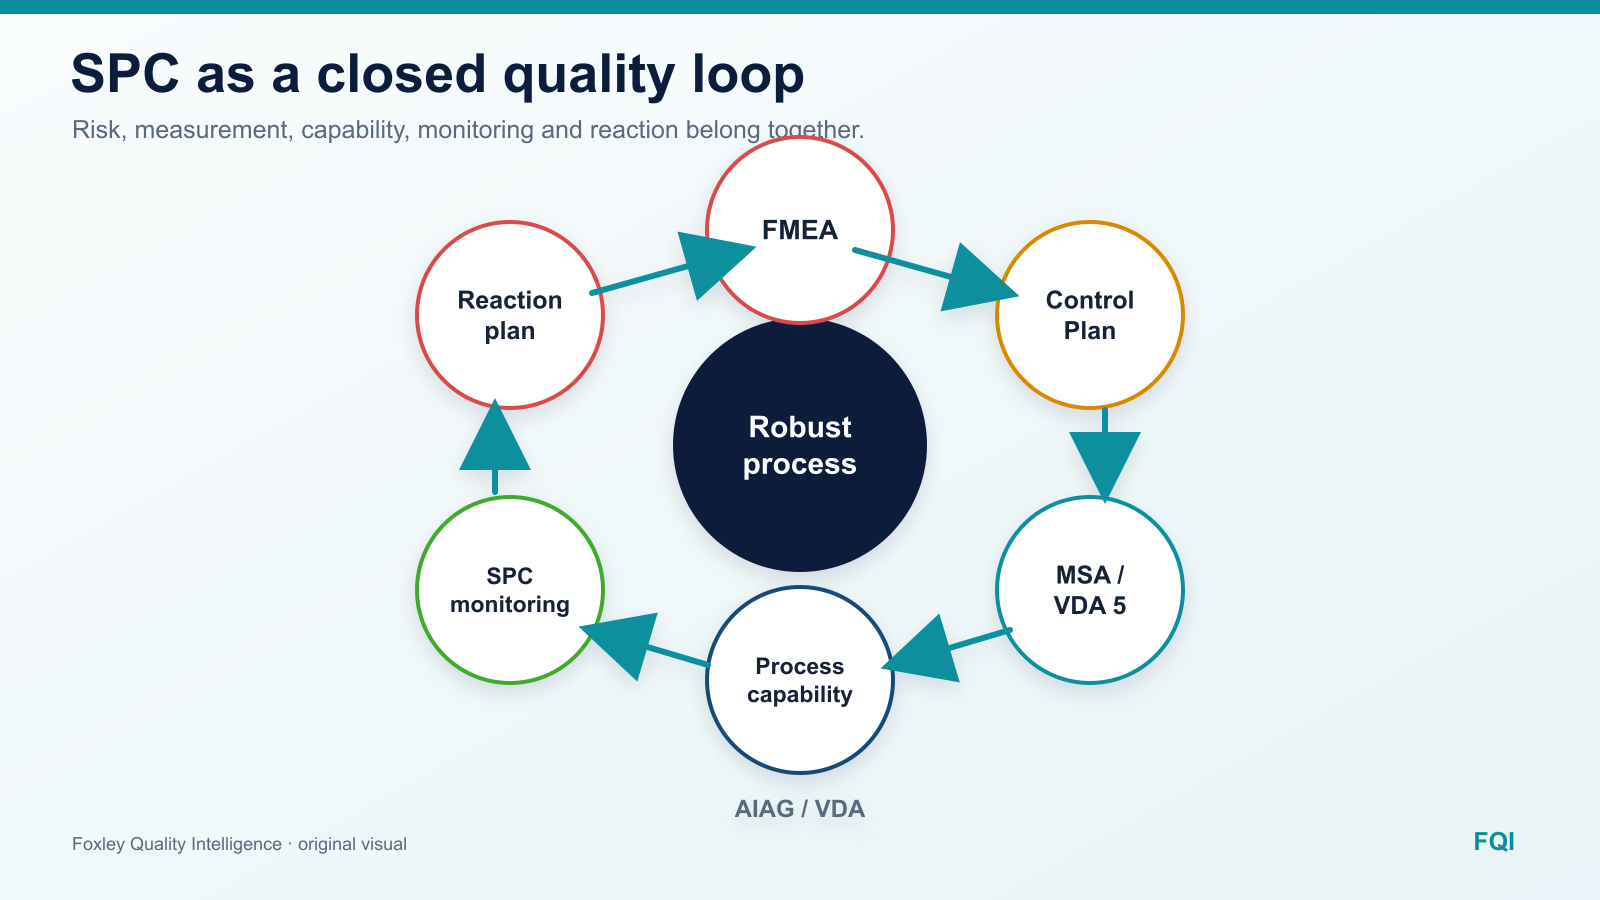
The professional value lies in the chain: FMEA identifies relevant risks and characteristics; the Control Plan defines control and inspection; MSA/VDA 5 assesses the fitness of the measurement process; capability studies assess process potential; SPC detects change; and the reaction plan feeds back into cause analysis and action.
Terms explained
- AI: Artificial intelligence; systems that derive patterns from data or support tasks automatically.
- FMEA: Failure Mode and Effects Analysis; a method for proactively assessing risks.
- SPC: Statistical Process Control; monitoring and controlling processes with statistical methods.
- MSA: Measurement System Analysis; checking whether a measurement system is fit for its intended decision.
- AIAG: Automotive Industry Action Group; a US industry association for shared automotive standards and quality methods.
- VDA: German Association of the Automotive Industry; an industry association that publishes automotive quality standards.
- PFMEA: Process Failure Mode and Effects Analysis for proactively assessing manufacturing risks.
Deep dive
What the publication actually establishes
The primary source is a joint announcement by the publishers, not the full manual. The publication, objectives, claim of an internationally harmonised method and the named application areas are supported. Details concerning formulas, samples, control-chart selection or binding customer requirements cannot be inferred from the announcement.
Harmonisation addresses a real supply-chain problem: different regional manuals, terminology and training approaches make comparison and joint release more difficult. A common reference may reduce parallel processes. Whether and when it becomes binding in a specific customer-supplier relationship depends on contracts, customer-specific requirements and transition rules.
FQI practical transfer
An organisation should not begin by replacing control-chart forms but by creating an impact map. Which customers require which revision? Which sites and suppliers use different definitions? Which software calculates capability metrics? Which training, work instructions and inspection plans are affected? Where must existing time series remain comparable despite a method change?
A pilot process should then be reviewed end to end. Special and high-risk characteristics flow from the PFMEA. The Control Plan assigns inspection method, frequency, sample and reaction plan. MSA or VDA 5 checks whether the measurement system can reliably detect change. Machine- and process-capability studies establish whether a stable and suitable starting condition exists. Only then is the appropriate SPC monitoring selected.
During the transition, old and new calculations should run in parallel, differences should be documented and borderline cases clarified with customers or suppliers. Training must explain decisions, not only formulas: What counts as a signal? Who stops or blocks production? How is a special cause investigated? When may the process be released again? Harmonisation creates value only through consistent response.
Limitations and risks
- The complete manual was not evaluated: This article relies on the public publisher announcement; detailed requirements must be checked in the original.
- No automatic contractual effect: Publication alone does not change every contract or customer-specific requirement.
- Breaks in historical data: Changed definitions or calculations can make trends and capability metrics appear to shift.
- Formal migration without effectiveness: New templates do not improve a process when measurement, signal interpretation and reaction remain weak.
- Transfer beyond automotive: The system logic is broadly useful, but normative or contractual applicability outside the intended scope does not follow automatically.
FQI conclusion
For FQI, the joint AIAG-VDA-SPC manual is primarily a signal against isolated quality tools. Risk, inspection planning, measurement capability, process capability, monitoring and response belong together. A good introduction therefore migrates not only formulas and forms but the complete decision chain. The next useful step is a pilot process with parallel calculation, clear customer alignment and a verified reaction plan. Detailed requirements should enter standards and training only after the original manual has been reviewed.
Sources & transparency
- AIAG/VDA: International Cooperation for Higher Quality: VDA and AIAG Publish Joint Standard for Statistical Process Control in the Automotive Industry, 1 July 2026.
- Publication, objectives and named method connections are source facts. The quality-control loop, impact map and pilot approach are FQI interpretations.
- The German source article and public primary source were reviewed on 14 August 2026. This AI-assisted English translation was prepared on 17 August 2026 and awaits renewed human review. The paid manual was not evaluated, so this article makes no detailed claims beyond the public announcement.
- Approval status: First-use explanations and the glossary were reviewed by a human and approved for publication on 17 August 2026. Approved by: Johann Fischer.