
Executive summary
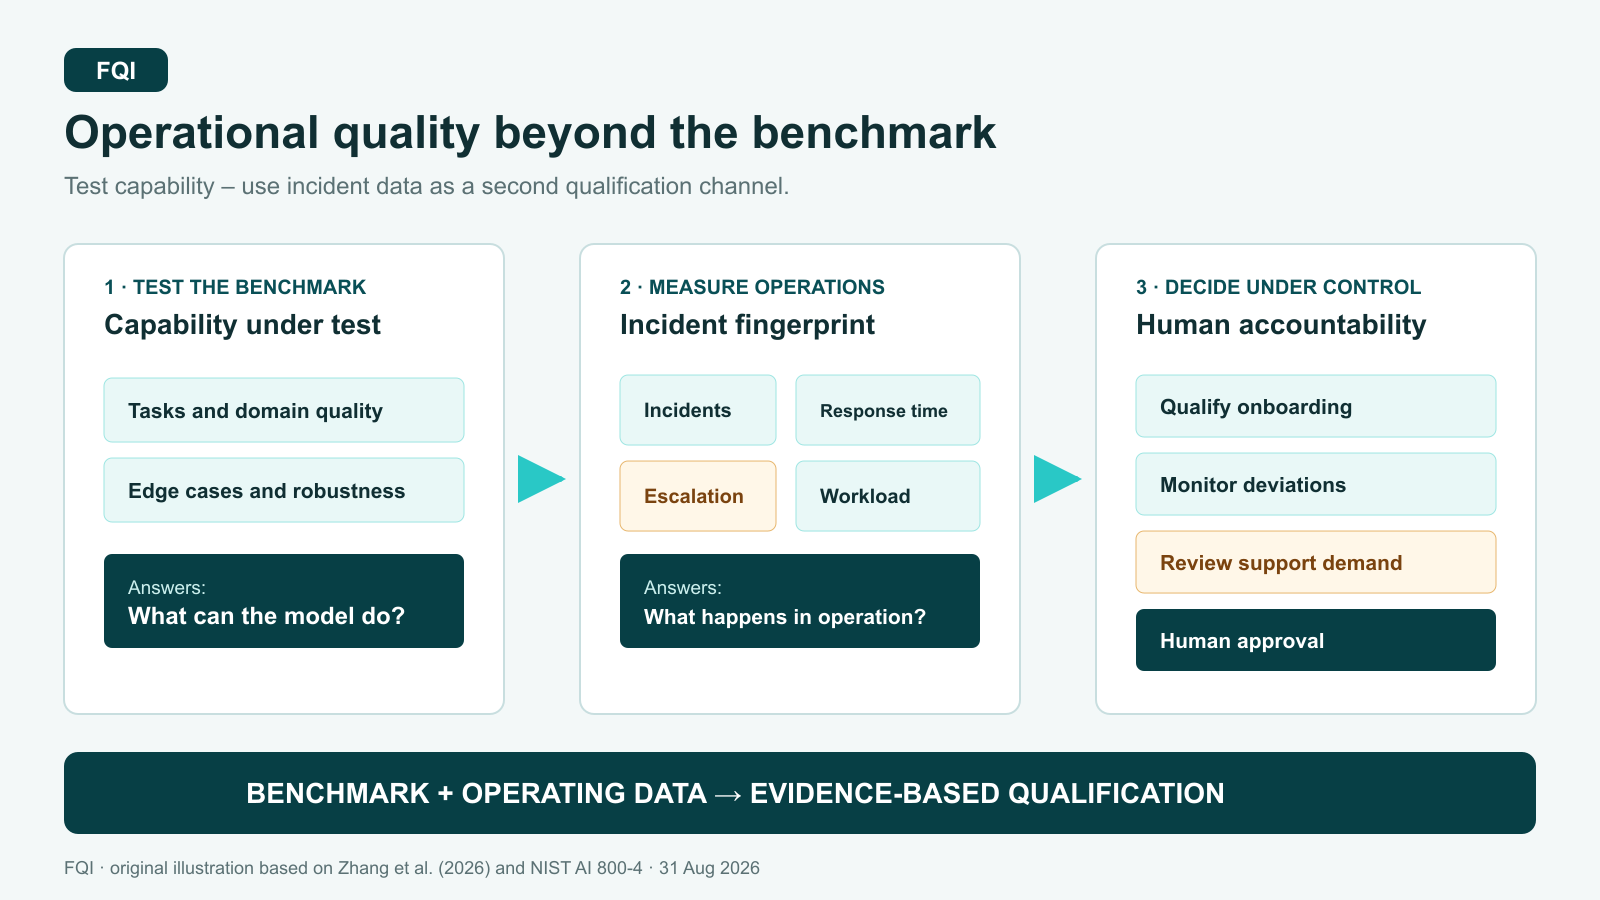
Capability benchmarks show what a large language model can do under test conditions. They do not show which disruptions, escalations and support burdens emerge after deployment. A new study condenses more than 33,000 real support cases from seven model families across 26 months into operational fingerprints. For FQI, this is not an automatic model-selection test. It is an additional qualification channel: incidents, response times and hand-offs need stable definitions, comparable baselines and clear human response rules.
FQI takeaway
- Operational evidence complements the benchmark: model capability, support effort and disruption behaviour are different quality dimensions.
- Metadata needs a controlled measurement system: categories, time windows, escalations and case mix must be defined and versioned consistently.
- Similarity is not approval: an operational fingerprint may support onboarding, monitoring and staffing, but it must not decide on its own.
The principle at a glance
The Google Cloud authors create a signature for each model and calendar month from 75 features across eight channels. These include the distribution of faults, temporal patterns, severity, resolution efficiency, communication dynamics, suspected causes, routing and workload. Case text and customer content are not used. A learning method projects these signatures into a smaller numerical space in which services with similar operating behaviour should lie close together.
The study compares this method with a global average, a model-family average and direct nearest-neighbour search on the raw features. The National Institute of Standards and Technology (NIST) is the US institute for standards and technology. It adds an important governance perspective: artificial intelligence (AI) systems require repeated monitoring, incident handling and feedback from field information into risk management. This is part of Test, Evaluation, Verification and Validation (TEVV) across the system life cycle.
Terms explained
- LLM: large language model; a model that processes and generates language.
- Incident: a recorded disruption or unexpected operating event that requires investigation and treatment.
- Embedding: a compressed mathematical representation in which similar datasets are located closer together.
- KNN: k-nearest neighbours; a method that derives estimates from the most similar known cases.
- TEVV: Test, Evaluation, Verification and Validation; structured evidence that requirements and the intended use are met.
- NIST: National Institute of Standards and Technology; the US institute for standards and technology.
- AI: artificial intelligence; systems that infer patterns from data or automate parts of a task.
Deep dive
The dataset contains more than 33,000 production support cases from seven LLM families over 26 months. In a leave-one-model-out evaluation, one model is held back and predicted from the remaining models. Reported coefficients of determination vary substantially by target and case mix. For technical cases, some escalation and consultation rates become much more predictable, while other measures remain weaker. This dependency matters to quality practitioners: a large share of routine quota requests can obscure the technical disruption pattern that the organisation actually wants to control.
An FQI pilot should therefore start with the decision purpose, not the learning model. Is the fingerprint intended to support onboarding, supplier comparison, support readiness or drift monitoring? The team then defines the case taxonomy, mandatory fields, time windows and responsibilities. Routine requests, confirmed product faults, configuration problems and unresolved cases should remain separate. Category or routing changes receive a revision because they may alter the fingerprint even when the service itself has not changed.
Transparent baselines are enough for the first analysis. A new service is compared with the overall portfolio, its own model family and groups with a similar case mix. Only when a more complex method consistently beats these baselines on held-out models or time periods may it add a further signal. Useful measures include fault rate, escalation rate, time to first response, number of hand-offs and communication effort. Each measure needs a definition, data lineage and known sources of bias.
During onboarding, the fingerprint should initially run in observation mode only. An unusual distance or shift triggers expert review: did the version, workload, customer group, quota policy or support process change? A control plan defines thresholds, reviewers, response time and escalation. Only a documented pilot can show whether the signal actually enables earlier detection, better staffing or less misrouting.
Limitations and risks
The data come from one Google Cloud support ecosystem and cannot be reproduced from an open dataset. Categories and workflows may reflect local processes rather than general model properties. Quota requests dominate parts of the data. The authors do not isolate the contribution of the three learning objectives, and a pure principal-component baseline is absent, so the added value of the complex method is not fully separated. The attached reviews also note that the work does not demonstrate real onboarding, staffing or triage decisions and their outcomes. The manuscript was accepted for an industry track but withdrawn from the official proceedings after the authors could not attend for organisational reasons.
FQI conclusion
A capability benchmark remains important, but it does not qualify a running service. Structured incident metadata can provide a second view: which faults occur, how severe are they, how quickly does support respond and where does additional assistance arise? This view becomes quality-capable only through a stable taxonomy, simple comparison baselines, held-out checks and a human-owned response plan. The operational fingerprint is therefore not a supplier seal. It is a measurement channel for controlled onboarding and post-deployment monitoring.
Sources & transparency
- Zhang et al.: Beyond Capability Benchmarks: Learning Operational Fingerprints of LLM Cloud Services from Production Incident Metadata, arXiv:2608.26332v1, submitted 26 August 2026; HTML full text.
- NIST: Challenges to the Monitoring of Deployed AI Systems, NIST AI 800-4, 2026; Artificial Intelligence Risk Management Framework 1.0, 2023.
- Evidence status: real but closed production data from one provider ecosystem; no published field impact of the proposed decisions. The taxonomy, pilot logic, control plan and approval limits are FQI interpretations. This Research Brief was prepared with AI support and reviewed by a human for subject matter and source accuracy on 30 August 2026.