
Executive summary
An absence of a statistically significant difference proves neither fairness nor adequate process quality. A preprint, a research paper that has not yet been peer reviewed, examines artwork ratings by artificial intelligence (AI). It reports similar group scores while highlighting limits of its metric. For FQI, this suggests a practical rule: define the intended quality characteristic, measurement sensitivity, acceptable differences and covered population before release. A reassuring result cannot substitute for this evidence.
FQI takeaway
- Qualify the metric: Use known faulty and fault-free cases to test whether it detects the relevant property under deployment conditions.
- Justify equivalence: Derive acceptable differences from risk in advance; a non-significant test does not demonstrate equality.
- Keep exclusions visible: Missing or unclassifiable records restrict the scope of the conclusion and belong in the release decision.
The principle at a glance
The study compares how two vision-language models associate 743 digitised artworks with word pairs such as “masterpiece” and “minor work”. It examines group differences, equivalence—similarity within specified margins—and influences such as medium, era and image shape. This text-defined score does not measure every dimension of fairness.
Terms explained
- AI: Artificial intelligence; here, models that learned relationships between images and text from training data.
- Construct validity: Whether a metric represents the property it claims to measure.
- Equivalence test: A test of whether a difference lies within practically acceptable margins.
- Confounding: Mixing an investigated relationship with the effects of other variables.
- CLIP: Contrastive Language-Image Pretraining; a model family for comparing images and text in a shared representation.
- NIST: The US National Institute of Standards and Technology.
Deep dive
The corpus contains 1,500 objects from the Metropolitan Museum of Art’s open collection. Usable creator attribution is unavailable for 618 objects, or 41.2%. Another 139 of the 882 attributed works lack usable images. The final sample contains 534 male-attributed and 209 female-attributed works: object counts, not distinct people. Binary attribution uses a name dictionary among other information and is itself fallible.
Two variants of Contrastive Language-Image Pretraining (CLIP; jointly trained image and text models) are tested. Three word pairs produce relative valuation scores without additional training for this task. The authors report no statistically significant group difference. They also use two one-sided tests to examine whether the mean difference lies within defined margins.
The sensitivity analysis reports equivalence for margins of ±0.25 or wider in Cohen’s d units, an effect size normalised by variability. With tighter margins of ±0.20, neither model meets the equivalence criterion. The choice of margin therefore matters to the decision. The study does not establish a universal industrial acceptance limit. Such a limit must follow from potential harm and intended use, before the results are known.
A regression examining several influences jointly explains less than 2% of score variability using creator attribution, medium, era and aspect ratio. The authors interpret this as a coarse metric operating near a noise floor. That interpretation must remain separate from the numerical finding: low R² alone demonstrates neither measurement insensitivity nor measurement noise. Missing predictors or an unsuitable regression model can also explain low predictive power. Construct validity—fitness to measure the claimed property—therefore requires additional reference tests.
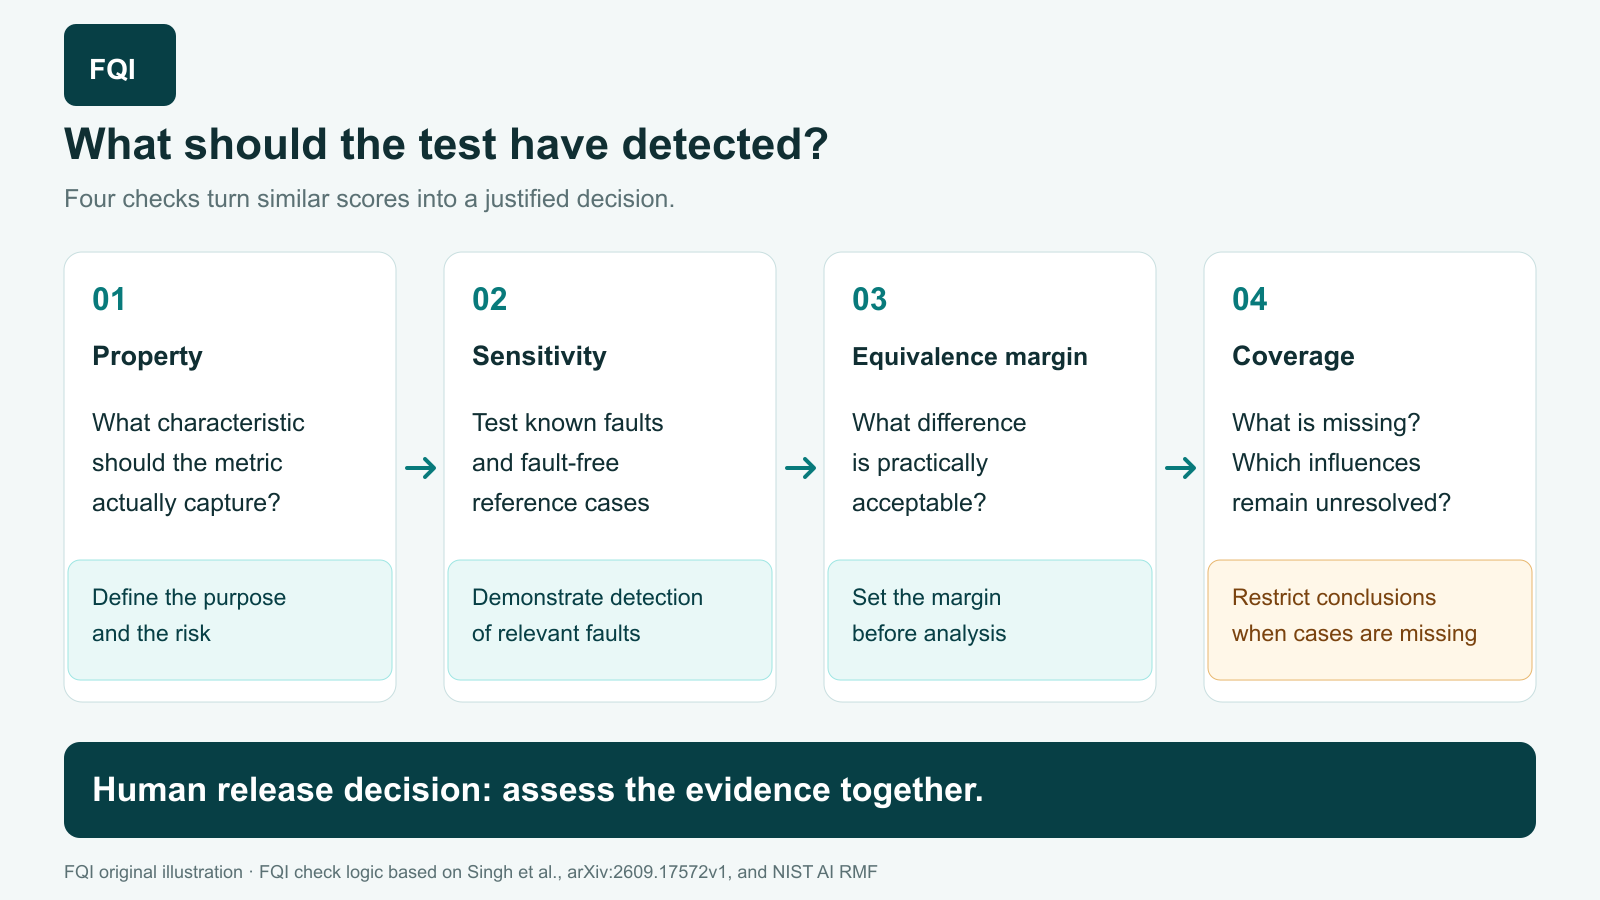
For measurement system analysis, FQI proposes four checks: define the characteristic operationally; demonstrate detection using known faulty and fault-free references; justify acceptable differences beforehand; and document confounders, exclusions and deployment conditions. An accountable person assesses the combined evidence. If sensitivity is inadequate, the conclusion remains open. If coverage is incomplete, restrict the conclusion or collect additional data.
The National Institute of Standards and Technology (NIST), the US measurement agency, supports this interpretation in its AI Risk Management Framework. Metrics should be appropriate, their effectiveness reassessed regularly and generalisation limits documented. This is evaluation guidance, not evidence of the proposed FQI procedure’s effectiveness.
Limitations and risks
The preprint examines one museum collection and two variants of the same model architecture. Almost three quarters of the final sample are paintings; only six sculptures remain. Excluded objects include ambiguous names as well as anonymous works. A few unremarkable balance tests do not establish that the 139 images are missing completely at random. Some supplementary figures are internally inconsistent: correctly classified names across era subgroups do not sum to the stated overall total. FQI therefore makes no accuracy guarantee based on that check. Results have not been independently reproduced; neither museum statistics nor effect-size margins are industrial release criteria.
FQI conclusion
The paper provides a reason to examine the evidential strength of reassuring results. Its value for quality management lies in questions about the measurement system: which property does it capture, which relevant deviation can it detect, and which cases are missing? Equivalence tests complement that assessment but cannot replace it. The interpretation of low R² also deserves scrutiny. A defensible release combines a suitable instrument with justified margins, documented coverage and an accountable decision.
Sources & transparency
- Singh, Bhatia and Joshi: Disentangling Algorithmic Bias from Archival Artifacts, arXiv:2609.17572v1, particularly Sections 3–6.
- National Institute of Standards and Technology: AI Risk Management Framework Core, particularly MAP 2.3, MEASURE 1.1–1.2 and 2.1–2.5.
Editorial note: Figures and study methods are reported source findings. The R² qualification, reference tests and four-step check logic are FQI interpretation. Prepared with AI assistance and checked against the cited sources.